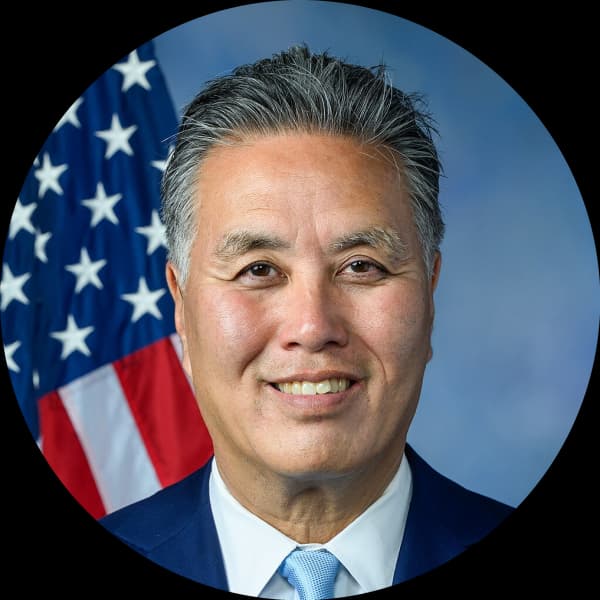
Mark Takano
California's 39th congressional district
CA-39 Midterms Intelligence
Mark Takano sits in a safely Democratic but not politically sleepy Inland Empire seat: CA-39 is D+13, yet recent movement shows a modest rightward drift. The district’s defining fact is its overwhelmingly Hispanic electorate at 63.3%, paired with a young median age of 33.1, giving Takano a coalition rooted less in old-line liberalism than in diverse, working- and middle-class families navigating cost pressures and public-service dependence. His long tenure and committee profile on Veterans’ Affairs and Education position him as a durable incumbent whose brand is civil rights plus kitchen-table governance.
For advocates, this is a persuasion environment where economics should carry the message and values should validate it. Median income is a solid $91,833, but that sits alongside 6.6% unemployment and 10.2% uninsured, creating an audience receptive to arguments about workforce training, affordable health access, and education-to-jobs pipelines. Campaigns framed around immigrant families, veterans, and practical community investment will travel; abstract ideological appeals will not. The strategic opening is to connect equity goals to stability, mobility, and local service delivery.
Economic & Demographic Snapshot
Data sourced from U.S. Census Bureau ACS 5-Year Estimates (2017-2021 vs. 2019-2023). All figures are statistical estimates with 90% confidence level.
California District 39 Demographics
Median Age 33.1 (vs 38.5) · Homeownership 62% (vs 65.5%) · Bachelor’s+ 19.9% (vs 33.7%) · Poverty 9.3% (vs 12.4%) · Income $91,833 (vs $37,585)
Age Distribution
Skews younger than the national average (median age 33.1 vs 38.5 nationally). 32% of residents are in the 20–39 working-age bracket — housing affordability, student debt, and workforce messaging indexes high.
Race & Ethnicity
A majority-minority district. Hispanic residents are the largest group at 63.3%. Also significant: White (25.3%).
* Hispanic includes respondents of any race. Racial categories include both Hispanic and non-Hispanic individuals.
Education
Only 19.9% hold a bachelor’s degree or higher, significantly below the 33.7% national average. 21% of residents lack a high school diploma.
Income Distribution
Median household income is $91,833, well above the $37,585 national median.
Housing
Homeownership at 62% (vs 65.5% nationally). Median rent is $1,943. Median home value is $543,300.
How People Get to Work
Car-dependent: 75% drive alone to work. Average commute is 33.3 minutes.
California District 39 FAQ
Reach California Lawmakers
Representative Takano focuses on Armed Forces and National Security, Civil Rights and Liberties, Minority Issues and Crime and Law Enforcement. Deliver personalized constituent letters to California's federal, state, and local officials — live in under five minutes.
Grassroots advocacy & legislator intelligence. Used by nonprofits, associations, and GR firms nationwide.
Start a Campaign