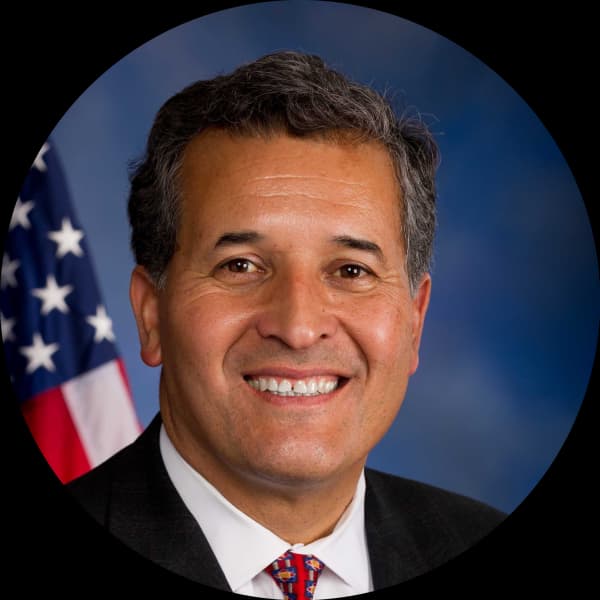
Juan Vargas
California's 52nd congressional district
CA-52 Midterms Intelligence
Juan Vargas sits in one of California’s safest Democratic seats, a D+33 district where Democrats routinely clear 66.3% and the real politics are coalition management, not general-election risk. The defining fact is its heavily Latino character—60.1% Hispanic—paired with a younger, working- to middle-class electorate squeezed by Southern California costs. Vargas’s Financial Services perch fits the district’s profile: high housing prices, meaningful renter pressure, and communities that are deeply tied to cross-border commerce, immigration, and public-sector responsiveness.
For advocates, this is a pocketbook-and-fairness district first. Median income is a solid $86,750, but that headline masks strain from $1,934 median rent and 7.6% unemployment, making affordability, consumer protection, and access-to-capital frames more potent than ideological appeals. Housing, banking access, environmental health, and government service delivery all travel well if tied to economic security for Latino families and working households. The strategic opening is that Vargas can be moved by arguments that blend constituent relief with institutional credibility, especially when local impacts are concrete and implementation-focused.
Economic & Demographic Snapshot
Data sourced from U.S. Census Bureau ACS 5-Year Estimates (2017-2021 vs. 2019-2023). All figures are statistical estimates with 90% confidence level.
California District 52 Demographics
Median Age 35.9 (vs 38.5) · Homeownership 50.3% (vs 65.5%) · Bachelor’s+ 25.3% (vs 33.7%) · Poverty 10.1% (vs 12.4%) · Income $86,750 (vs $37,585)
Age Distribution
Skews younger than the national average (median age 35.9 vs 38.5 nationally). 30% of residents are in the 20–39 working-age bracket — housing affordability, student debt, and workforce messaging indexes high.
Race & Ethnicity
A majority-minority district. Hispanic residents are the largest group at 60.1%. Also significant: White (23.8%), Asian (14.5%).
* Hispanic includes respondents of any race. Racial categories include both Hispanic and non-Hispanic individuals.
Education
25.3% hold a bachelor’s degree or higher, below the 33.7% national average. 19.8% of residents lack a high school diploma.
Income Distribution
Median household income is $86,750, well above the $37,585 national median.
Housing
Homeownership at 50.3% (vs 65.5% nationally). Median rent is $1,934. Median home value is $690,200.
How People Get to Work
Car-dependent: 70.1% drive alone to work. Average commute is 27.1 minutes.
California District 52 FAQ
Reach California Lawmakers
Representative Vargas focuses on Finance and Financial Sector, Housing and Community Development and Environmental Protection. Deliver personalized constituent letters to California's federal, state, and local officials — live in under five minutes.
Grassroots advocacy & legislator intelligence. Used by nonprofits, associations, and GR firms nationwide.
Start a Campaign